So, you’re having trouble with your program? Now’s a good time to jump into debugging!
Technique 1: Print Debugging
Sometimes, the simplest methods are the best. Print debugging simply means putting a Console.WriteLine call somewhere in your code, to print out the value of a variable or set of variables. It can also be used to deduce the order of function calls, or count how often a section of code is being called. It’s a versatile but simple tool in our bag of debugging tricks.
Upsides of print debugging:
- easy/quick method that only exists in code
- can write messages to provide context to the output
- easier to review a large amount of output/data at once (like printing information inside a loop)
- don’t need to learn a specific debugger (MSVC, gdb, etc)
Downsides of print debugging:
- code/calculations are particularly complex may not lend themselves well to print debugging
- in (very) large projects, recompiling the code can be prohibitive
- tracking where to add/remove print calls can be tedious and error-prone
The simplest way to go about debugging with print is to put a call to Console.WriteLine or Console.Write in a section of code where you’d like to diagnose an issue. Consider the following (contrived) example, where we want to calculate the sum of numbers between 1 and 5, inclusive:
    //We want to know the sum of the numbers
    //between 1 and 5, inclusive
    int sum = 0;
    for (int i = 0; i < 5; ++i)
    {
        sum += i;
    }
    Console.Write($"Sum of numbers 1 to 5: {sum}");
Output:
Sum of numbers 1 to 5: 10
Whelp, that isn’t correct! We were expecting 1+2+3+4+5, which is 15. So where did we go wrong? We can insert a print statement into our loop to see what’s happening:
    //We want to know the sum of the numbers
    //between 1 and 5, inclusive
    int sum = 0;
    for (int i = 0; i < 5; ++i)
    {
        Console.Write($"Previous sum: {sum} | Adding to sum: {i} | ");
        sum += i;
        Console.Write($"Current sum: {sum}\n");
    }
    Console.Write($"Sum of numbers 1 to 5: {sum}");
Output:
Previous sum: 0 | Adding to sum: 0 | Current sum: 0
Previous sum: 0 | Adding to sum: 1 | Current sum: 1
Previous sum: 1 | Adding to sum: 2 | Current sum: 3
Previous sum: 3 | Adding to sum: 3 | Current sum: 6
Previous sum: 6 | Adding to sum: 4 | Current sum: 10
Sum of numbers 1 to 5: 10
Now we can see what we’re doing at each step of our loop, which illuminated the issue: we’re adding the numbers 0 to 4 inclusive, not 1 to 5. Now we can remove our print statements and fix our error:
    //We want to know the sum of the numbers
    //between 1 and 5, inclusive
    int sum = 0;
    for (int i = 1; i <= 5; ++i)
    {
        sum += i;
    }
    Console.Write("Sum of numbers 1 to 5: {sum}");
Output:
Sum of numbers 1 to 5: 15
Technique 2: Using the MSVC Debugger
The MSVC debugger is a powerful tool for tracking down bugs and inspecting your code as it runs. Certain kinds of bugs may be easier to diagnose using the debugger, as opposed to print debugging. This note barely scratches the surface of the MSVC debugger’s capabilities, but we’ll go over the basics to get you started.
Setting Breakpoints
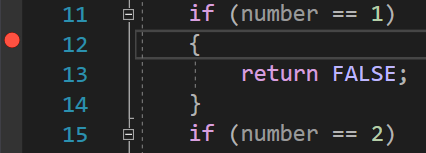
Breakpoints allow you to stop the execution of your code while it is running. This is useful for inspecting the values of certain variables or formulas in real-time as the code is running, and to catch bugs that might be trickier or impossible to catch via print debugging.
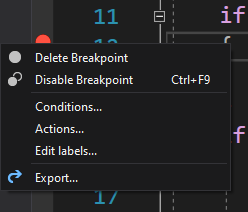
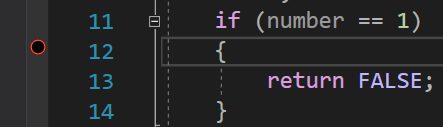
There are two ways to add new breakpoints to your code: you can either click in the margin to the left of your code, or you can press F9 to add or remove a breakpoint from the current line (where your typing caret is). Using Ctrl+F9 or right-clicking the breakpoint and selecting “Disable Breakpoint” will disable the breakpoint, making it inactive but leaving it on its current line (this is a convenience to ensure you don’t forget where a breakpoint might have existed previously).
(A breakpoint added to code)
(Context menu for deleting or disabling breakpoints)
(A disabled breakpoint)
Keyboard Shortcuts:
LAPTOPS AND FUNCTION KEYS!
If you’re using a laptop, make sure you’re using the function keys, rather than whatever built in nonsense is strapped to your function keys. Often utilities like screen brightness or speaker volume exist on the lower function keys like F2 through F5. Just make sure to press something that will switch the function keys to be the ACTUAL function keys; there’s usually a FN key near the bottom of the keyboard for this purpose.
F5 → Run until another breakpoint is hit
F10 → Step to the next line of code but don’t enter function calls (the function still runs, but the debugger lets the whole function run without losing your place in the current function/code file)
F11 → Step to the next line of code, but enter any function calls
Other useful tips!
Pinning the values of variables (there’s a small pin icon on them when hovered with the mouse) can be VERY useful to watch their values change as you step through lines of code!